News   Apr 03, 2020
 4.6K     1 
News   Apr 02, 2020
 6.5K     3 
News   Apr 02, 2020
 3.7K     0 

Statscan 2017 numbers

2016 census visible minority Calgary NE, North of McKnight and East of Metis Trail by census tract(s) and community .

Calgary Saddleridge census tract 8250038.32 - a portion is missing and included in Cityscape, Redstone
8,440 Population
7,560 visible minority 90%
4,905 South Asian
1,265 Filipino
405 Black
245 Southeast Asian
235 West Asian
125 Chinese
120 Arab
40 Latin American


Calgary Taradale census tracts 8250038.33, 8250038.34
19,520 population
17,250 visible minority 88%
11,240 South Asian
2,365 Filipino
1,335 Black
540 Latin American
445 West Asian
425 Arab
400 Southeast Asian
165 Chinese
20 Korean


Calgary Coral Springs census tract 8250038.27
5,915 population
5,075 visible minority 86%
3,350 South Asian
485 Filipino
435 Southeast Asian
250 Chinese
135 Black
90 Arab
45 Latin American
40 West Asian


Calgary Cityscape, Skyview, Redstone, and a portion of Saddleridge census tract 8250038.31
23,810 population
20,195 visible minority 85%
12,705 South Asian
2,660 Filipino
1,625 Black
735 West Asian
560 Latin American
535 Chinese
450 Southeast Asian
230 Arab
40 Korean
20 Japanese


Calgary Martindale census tracts 8250038.39, 8250038.30
15,020 population
11,865 visible minority 79%
8,140 South Asian
1,395 Filipino
800 Black
395 Latin American
240 Arab
230 Southeast Asian
225 West Asian
150 Chinese
10 Japanese


Calgary Castleridge census tract 8250038.18
6,465 population
4,280 visible minority 66%
2,500 South Asian
575 Black
560 Filipino
195 Chinese
165 Southeast Asian
115 Latin American
95 Arab
60 West Asian
10 Japanese


Calgary Falconridge census tracts 8250038.17, 8250038.28
10,895 population
6,630 visible minority 61%
3,080 South Asian
1,295 Black
835 Filipino
365 Arab
310 Latin American
250 Southeast Asian
205 Chinese
130 West Asian
15 Japanese
10 Korean
 
Last edited:
Census Profile 2016

"The Properties" consists of 4 communities in NE Calgary, named after 4 mountains. Boundaries, McKnight Boulevard NE, 16 Avenue NE, 36 Street NE, 68 Street NE. I believe that the development of these 4 communities began in the 70s.

Calgary Whitehorn census tracts 8250038.15, 8250038.13
12,130 population
8,395 visible minority - 69%
3,420 south Asian
1,135 Filipino
1,110 black
945 Arab
540 Chinese
440 southeast Asian
255 Latin American
240 west Asian
25 Japanese

Calgary Rundle census tracts 8250038.11, 8250038.10
11,260 population
7170 visible minority - 64%
1,365 Filipino
1,535 south Asian
1,310 black
1,230 Arab
570 Chinese
515 southeast Asian
265 Latin American
205 west Asian
10 Japanese

Calgary Temple
11,475 population
6,270 visible minority - 55%
1,940 south Asian
1,085 black
1,020 Arab
695 Filipino
420 southeast Asian
385 Latin American
335 Chinese
185 west Asian
30 Japanese
10 Korean

Calgary Pineridge census tracts 8250038.12, 8250038.23
10,135 population
4,705 visible minority - 46%
1,330 south Asian
830 black
695 Arab
615 Filipino
290 Chinese
280 southeast Asian
260 west Asian
235 Latin American
20 Japanese
10 korean
 
Hey @Blader , which Cansim table are you getting the minority population breakdown from? If indeed you're getting that from a Cansim table. I'd love to be able to recreate something like this map with more up to date data.
 
@Oddball
The link below is a start. On the left is the census track, on the right is Calgary (CY). There's a drop down menu with many categories that one can peruse. Then, there is the ability to change geography by postal code. There's a map for each census tract, which I try to match to community. Sometimes, I get an exact match. Often there are two census tracts in a community. I use Google maps to pull postal codes for a different tract. It takes a bit of exploration. I hope this is helpful. If not, ask more.


http://www12.statcan.gc.ca/census-r...egins&SearchPR=01&B1=Visible minority&TABID=2
 
I was doing some mucking around in Tableau with the Census Division level ethnic data. We just got Tableau, so it's been an interesting way to muck around in it. Here's the most popular Ethnic group by Census Division for Alberta.

upload_2018-5-23_17-22-13.png


Make note that the numbers are responses not population and that there can be multiple responses so all told it adds up to more than the total population for a given area. There is a tendency for older Canadian population would be generally, British, French, Native, other western Europeans and Canadian respondents to have higher multi-response rates. You can see the national level data here. For example, of people reporting as First Nations only 1/3rd or respondents gave it as a single response. So most First Nations people see themselves as "Cree" and something else. These are self reported ethnicities btw.

Note, that these are strictly people who said "Canadian" or "French" because there are people who reported as things like "Newfoundlander," "Quebecois," or "Alsatian" and "Breton" and if there were enough responses they weren't automatically lumped in with "Canadian" or "French." Did you know that there were 55 responses province wide for people self reporting as "Ethnic New Brunswickers?" Lol, I'm suprised there weren't enough responses for an "Ethnic Albertan" category. Lord knows we feel it some times. :p

Here's maps for the 2nd through 5th most reported ethnicities for the CDs. Canadian, English, First Nations, German, French, Scottish, Irish and Ukranian are the only ones to appear in the top 5 for any Alberta CD.

Second Most Reported
upload_2018-5-23_17-31-21.png
Third Most Reported
upload_2018-5-23_17-33-2.png
Fourth Most Reported
upload_2018-5-23_17-33-34.png
Fifth Most Reported
upload_2018-5-23_17-35-31.png

EDIT: CD12 gets my vote for the most interesting Alberta CD. It's the first to report French (2nd), the first to report Ukranian (4th) and 3rd to report First Nations (5th).

Also, sorry about the projection that makes Alberta look derpy up North. Apparently you can change the projection in Tableau, but it is not for the faint of heart.
 

Attachments

  • upload_2018-5-23_17-22-13.png
    upload_2018-5-23_17-22-13.png
    116.4 KB · Views: 605
  • upload_2018-5-23_17-31-21.png
    upload_2018-5-23_17-31-21.png
    112.5 KB · Views: 322
  • upload_2018-5-23_17-33-2.png
    upload_2018-5-23_17-33-2.png
    115.7 KB · Views: 330
  • upload_2018-5-23_17-33-34.png
    upload_2018-5-23_17-33-34.png
    112.5 KB · Views: 346
  • upload_2018-5-23_17-35-31.png
    upload_2018-5-23_17-35-31.png
    115 KB · Views: 358
Last edited:
Behold! The Results of Yet More Mucking About in Tableau!

upload_2018-5-24_11-41-25.png

I've got it set up right now so that it shows a map of all the Census Divisions in Canada and you can select a (or more than one) ethnicity from a list and it colours the map by percentage of population in that CD. And in the top corner it shows the top CDs by population of that ethnic group. I picked Scottish because it's readily prevalent nationally, but it has some obvious concentrations. I'm sure we all saw Cape Breton coming, but who knew BC was so Scottish?

Let me know if you guys have any special requests. Perhaps you're a Uighur enthusiast? Or a faithful Coptic? Or maybe you want to see which CD reports the highest common instance of Jewish and Singaporean. (With multiple selections, it adds them together.)
 

Attachments

  • upload_2018-5-24_11-41-25.png
    upload_2018-5-24_11-41-25.png
    358.8 KB · Views: 614
I had an interesting thought today, and I decided to pull up some data from the US Bureau of Statistics to confirm my notion. Without further ado, my shower-thought worthy question was how Lethbridge CMA and future Red Deer CMAs compare to the largest Metropolitan Statistical Areas (MSAs) in the state of Montana. I don't think Canadian CMAs and US MSA are a roughly 1-to-1 match up, but I think they're probably close enough to get the feel. If anything I get the sense that US MSAs are probably a little more generous than their Canadian counterparts. But that's only a subjective sense I get from maps like this.

Moving right along. The Lethbridge CMA has a population of 117,394 for the 2016 census. Unfortunately Lethbridge hasn't yet been included in the annual estimates for CMAs so that's the most up to date data for it.

Red Deer isn't yet a CMA, but it should be by the time the next census rolls around, based on it's population in excess of 100K simply for the city itself and with no inclusion of outlying areas. So there are a few of possible definitions:

  • Red Deer proper - 100,418
  • Red Deer County and all enclosed centres of population - 148,815
  • Red Deer and Lacombe Counties and all enclosed centres of populaiton - 185,608
  • Alberta Census Division 8 (Red Deer, Lacombe and Ponoka Counties and all enclosed centres of population - 209,395
All of these stats are also from 2016. My best guess is that it'll be option 3, Red Deer and Lacombe counties on account of Blackfalds and Lacombe being so close to Red Deer. Hard to say though. The minimum would probably be option 2, just Red Deer County. For illustrative purposes I'm going to go with number 3.

I'll also throw in Calgary and Edmonton's CMA data from the 2016 census for good measure, though there are different estimates available. This data at least most comparable to that of Lethbrigde and Red Deer.

The US uses a slightly different system. They do a decennial census on the 0s (e.g. 1990, 2000, 2010) and have estimates for all their MSAs for each year in between. So they do have 2017 estimates, but I'll stick to comparing apples to as-close-to-apple-like-things as possible and use the 2016 MSA estimate for Montana.

Here's what the combined 2016 MSA & CMA ranking looks like:
  1. Calgary, AB - 1,392,609
  2. Edmonton, AB - 1,321,426
  3. Red Deer, AB (option 3) - 185,608
  4. Billings, MT - 168,961
  5. Lethbridge, AB - 117,394
  6. Missoula - 115,896
  7. Great Falls - 81,488
So not only are Calgary and Edmonton larger than anything in our only bordering state, likely so is Red Deer and Lethbrige would be middle of the pack if it were in Montana. It just kinda goes to show the lopsided relationship that exists between Alberta and Montana. Maybe I'll do so more digging around the US border states, but I think it might be the most lopsided relationship between a Canadian Province and it's US counterparts. (Quebec clearly crushes Vermont, but it also borders New York, New Hampshire and Maine.)


Quebec crushes Vermont, New Hampshire, Maine, and all of Upstate New York. I think even combined Quebec is larger in population than all of those regions, or at least close to it. Alberta knocks everywhere in the US near us out of the water by a massive margin. The only US major cities within a thousand kilometres are Seattle, Portland, and Spokane. The next closest being Salt Lake City (1,200 km), Denver (1,500 km), and San Francisco (1,600 km). Ontario, BC, Manitoba, Saskatchewan and New Brunswick are all pretty much on par with their American neighbours.
 
Last edited:
I'm pretty sure you're right about that. I don't believe the commute rule is used in the U.S. calculation, or if it is, it's used differently. You get these cray large metro areas like Salt Lake city which is 2.3 million people.....but covers almost 60,000 sq kms When you look at some of the various metros in the U.S., the distance they cover is enormous.

I had an interesting thought today, and I decided to pull up some data from the US Bureau of Statistics to confirm my notion. Without further ado, my shower-thought worthy question was how Lethbridge CMA and future Red Deer CMAs compare to the largest Metropolitan Statistical Areas (MSAs) in the state of Montana. I don't think Canadian CMAs and US MSA are a roughly 1-to-1 match up, but I think they're probably close enough to get the feel. If anything I get the sense that US MSAs are probably a little more generous than their Canadian counterparts. But that's only a subjective sense I get from maps like this.

Moving right along. The Lethbridge CMA has a population of 117,394 for the 2016 census. Unfortunately Lethbridge hasn't yet been included in the annual estimates for CMAs so that's the most up to date data for it.

Red Deer isn't yet a CMA, but it should be by the time the next census rolls around, based on it's population in excess of 100K simply for the city itself and with no inclusion of outlying areas. So there are a few of possible definitions:

  • Red Deer proper - 100,418
  • Red Deer County and all enclosed centres of population - 148,815
  • Red Deer and Lacombe Counties and all enclosed centres of populaiton - 185,608
  • Alberta Census Division 8 (Red Deer, Lacombe and Ponoka Counties and all enclosed centres of population - 209,395
All of these stats are also from 2016. My best guess is that it'll be option 3, Red Deer and Lacombe counties on account of Blackfalds and Lacombe being so close to Red Deer. Hard to say though. The minimum would probably be option 2, just Red Deer County. For illustrative purposes I'm going to go with number 3.

I'll also throw in Calgary and Edmonton's CMA data from the 2016 census for good measure, though there are different estimates available. This data at least most comparable to that of Lethbrigde and Red Deer.

The US uses a slightly different system. They do a decennial census on the 0s (e.g. 1990, 2000, 2010) and have estimates for all their MSAs for each year in between. So they do have 2017 estimates, but I'll stick to comparing apples to as-close-to-apple-like-things as possible and use the 2016 MSA estimate for Montana.

Here's what the combined 2016 MSA & CMA ranking looks like:
  1. Calgary, AB - 1,392,609
  2. Edmonton, AB - 1,321,426
  3. Red Deer, AB (option 3) - 185,608
  4. Billings, MT - 168,961
  5. Lethbridge, AB - 117,394
  6. Missoula - 115,896
  7. Great Falls - 81,488
So not only are Calgary and Edmonton larger than anything in our only bordering state, likely so is Red Deer and Lethbrige would be middle of the pack if it were in Montana. It just kinda goes to show the lopsided relationship that exists between Alberta and Montana. Maybe I'll do so more digging around the US border states, but I think it might be the most lopsided relationship between a Canadian Province and it's US counterparts. (Quebec clearly crushes Vermont, but it also borders New York, New Hampshire and Maine.)
 
It's all relative when it comes to density, and I don't always agree that height is a problem, but design can be (in which height and street interface, shadows, flexibility of spaces are components). Here's a random brain dump and some useful statistics that might be worth throwing into the conversations:

Let's put Calgary into perspective with it's contemporaries closer to home. 10,000 people / km2 is a rough idea of what is required to support local pedestrian-oriented retail - sometimes more, sometimes less. Globally, 10,000 people /km2 is quite low in most European and Asian cities considered anywhere near vibrant, but for Canada it's not a bad place to start. Keep in mind that population density ignores the far harder to measure "bridge and tunnel" population (e.g. downtown is a good place for retail due to number of people who visit, not number of people who live there etc.) Destination streets always can get a vibrancy benefit by the tourist, non-local visitors.

The following table I threw together from 2016 Statscan data. Here's the link for the data-nerd folks link. Also there are definitions of what a Census Tract (CT) is on there, I won't get into it here. By 2021 I think all these cities will see a few more census tracts over the arbitrary threshold. Most importantly for folks that dream of a more urban Calgary that demands more urban designs and has more urban vibrancy (whatever that means to you), the total population living at higher densities is important for political, economic and cultural clout:

CityNumber of CTs over 10,000 people / km2Population living at 10,000 people / km2
Edmonton15,362
Calgary214,163
Ottawa525,900
Vancouver43227,000
Toronto121690,000
Montreal180590,000
  • The densest Census Tract in Alberta is in Calgary, in the Beltline's most developed core area - roughly 14 to 8 St W, 10 to 17 Ave S. This stretch has a 2016 population of 8,109 and a density of 14,134 / km2. This area will see further density increases in 2021 census due to all the residential towers near the Midtown CO-OP that should be counted by then.
  • We *may* have a third CT over the density threshold in 2021, essentially the other central chunk of the Beltline from 10 to 17 Ave S and 8 St W to Macleod-ish due to the growth in the area
  • Interesting side-fact: Alberta only had 3 census tracts with over 10,000 people / km2 in 2016 (2 Calgary, 1 Edmonton)
  • Inglewood gets unfairly screwed in Statscan analysis by the geographic threshold of it's CT, it's too small of a population so get lumped into a giant area including the railyards with only 4,078 people. Obviously this creates a very low density (770 people / km2). The City's geographies are more generous, giving the neighbourhood somewhere double that (~1,500 people/km2) if we use the City's neighbourhood boundary.
  • In general Calgary's density takes a hit for CT-based density calculations due to our far greater supply of open space getting lumped into the area calculations. This is due to mostly to our far above average supply of park space and rivers/floodways, followed closely by our really low lot coverage rations from lawns, setbacks and wasted space between built structures.
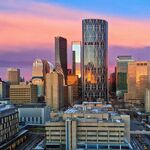
My point of digging into all this is 12 storeys or not, Inglewood is nowhere near dense by Calgary, Canadian and certainly not Mexico City standards. I prefer dense 6 storey neighbourhoods too, but with our setbacks and low coverage ratios, Inglewood could tear down every single low-rise on all streets and still struggle to reach a more typical vibrant urban threshold. Height is required to get anywhere close. If designed properly it's not a deal breaker by any means.
Quoted from the RNDSQR Inglewood thread. It's likely a couple of the Beltline CTs will get split as they they were delineated based on 2011 stats and a lot has changed since. 8250031 and 8250045 are now over the upper population guideline and that's not including the population growth that has happened since 2016. It's also possible that 8250044 gets split as well.
 

Back
Top