News   Apr 03, 2020
 4.6K     1 
News   Apr 02, 2020
 6.5K     3 
News   Apr 02, 2020
 3.7K     0 

Calgary & Alberta Economy

Oddball

Senior Member
Member Bio
Joined
Mar 18, 2016
Messages
1,131
Reaction score
1,462
Obviously the economic situation is something that is weighing heavily over Calgarians and other Albertans. A few discussions have started to pop up in other threads so I thought it might me a good idea to have a dedicated thread for sharing news and holding discussions.

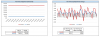
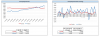
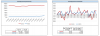
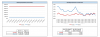
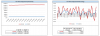
I've prepared some graphics on recent employment statistics for Alberta and for Canada to help guide the discussion. The number are from Statcan, the graphics are my own. The stats cover the period from April 2014 to August 2016. Unfortunately, this particular data set is at the provincial level. So I can't drill down to Calgary, but perhaps when I have more time I can find a set that will allow me to do so.

I think the two most striking things to me are the decline in the growth rate of Alberta's Working population (Statcan Definition: Number of persons of working age, 15 years of age and over. Estimates in thousands, rounded to the nearest hundred.), and the continued rise in unemployment. I think if I were a potential developer, these would be the two stats I'd be most concerned with. Hopefully they'll start turning the corner soon.

Most of the other metrics are fairly flat. There are less people working full time and more people working part time, but not by huge amounts. Most of the growth in the labour force has gone into the pool of the unemployed. Labour force participation is down, but not strikingly so yet.

Working Population.png

Labour Force.png

Full-Time Employment.png

Part-Time Employment.png

Unemployment.png

Unemployment Rate.png

Labour Force Participation Rate.png
 

Attachments

  • Full-Time Employment.png
    Full-Time Employment.png
    58.2 KB · Views: 2,265
  • Labour Force Participation Rate.png
    Labour Force Participation Rate.png
    55.6 KB · Views: 1,982
  • Labour Force.png
    Labour Force.png
    54 KB · Views: 2,320
  • Part-Time Employment.png
    Part-Time Employment.png
    60 KB · Views: 2,118
  • Unemployment Rate.png
    Unemployment Rate.png
    59.4 KB · Views: 2,033
  • Unemployment.png
    Unemployment.png
    55.2 KB · Views: 2,046
  • Working Population.png
    Working Population.png
    32.3 KB · Views: 2,360
Agreed. As you can see the rate is starting to sag as time goes on, but you can't really point to a long term trend yet. I was pleasantly surprised to see that the participation rate was so high.
 
Great News Everybody! The unemployment rate has risen! It now sits at an astonishing 10.3%!

I'm sure you're all saying Oddball, this must be some morbid joke. Not so friends, becuase there are actually some good things underlying the rise in the unemployment rate. I'm sure we've all seen a gloomy sounding article like this one. It's the worst times since blah-de-blah-de-blah or Hell hath opened and Calgary is being punished for its sins or something to that general effect.

First a little backgrounder. I found a new CANSIM table that has labour force statisical estimates by Census Metropolitan Area (CMA). The Calgary CMA, is pretty much the federal government calls the Calgary Metropolitan Area. It's pretty good estimate, but not perfect IMO. The Calgary CMA includes Calgary, Airdrie, Beiseker, Chestermere, Cochrane, Crossfield, Irricana, Rocky View County and Tsuu T'Ina Nation 145. It's pretty good analog, but were it up to me I'd probably dump Irricana and Crossfield and include Okotoks and High River. That's only fiddling with the edges anyway. So long as the definition you're using includes Calgary and Airdrie you're you've got well over 90% of the population covered.

The last bit of chart-y goodness I posted was based on provincial numbers. So, it was skewed by Edmonton data. Which in my opinion unfairly sheltered from the effects of the downturn by the provincial government. (Which I hate with a burning passion, but that's another story.) Anyway, by having CMA data we can get a much better idea of what's actually happening in our city. And I'll lead off with this chart:

upload_2016-12-2_13-36-44.png


UP = BAD!


Is the general assumption. And, I'm not really going to dispute that. The unemployment rate really doesn't tell the full story of labour force statistics though. And I'm going to illustrate that with the next graph.

upload_2016-12-2_13-48-13.png


UP = GOOD!

Wait what!? How can there be roughly 15,000 more people working today than there was two years ago if the unemployment rate has risen by almost 6%? What is this devilry Oddball? Be thou a sorcerer Oddball? You might say... well you might... I don't know if you have a fondness of renaissance fairs. Anyway, I'm not an economist, I'm just a guy who looks at data for a living and the story is all there to be told by the numbers themselves. Which brings me to the next charts.

upload_2016-12-2_13-53-28.png

upload_2016-12-2_13-54-9.png


UP = GOOD! MOSTLY!

Calgary's unemployment rate and the number of people employed grey because the working population (people of the age of 15) grew and the proportion of those people working or seeking work also grew. The downside here is that the number of people seeking work grew mor rapidly than the people who have work. Which in itself isn't entierly bad, because the growth in job seekers has come from people reentering the work force! The labour force participation rate is now higher than at any time since April - May of 2015 and is way up from it's low point in June of this year.

upload_2016-12-2_13-59-10.png


UP = GOOD!

MORAL OF THE STORY!

Yes unemployment is up, but it's being driven by population growth and people entring the work force. And, There are more people working today than at any other time this year. So, here's hoping the Christmas present from OPEC can help drive absorbtion of the unemployed population and we can see that overblown unemployment stat driven down.
 

Attachments

  • upload_2016-12-2_13-36-44.png
    upload_2016-12-2_13-36-44.png
    36.5 KB · Views: 1,499
  • upload_2016-12-2_13-48-13.png
    upload_2016-12-2_13-48-13.png
    40.4 KB · Views: 1,474
  • upload_2016-12-2_13-53-28.png
    upload_2016-12-2_13-53-28.png
    36.5 KB · Views: 1,433
  • upload_2016-12-2_13-54-9.png
    upload_2016-12-2_13-54-9.png
    37.5 KB · Views: 1,447
  • upload_2016-12-2_13-59-10.png
    upload_2016-12-2_13-59-10.png
    42.5 KB · Views: 1,457
Last edited:
Excellent post Oddball! I was just talking to my father in law about the various stats surrounding unemployment. I wish I had seen these beforehand, as it tells more of a full story.
 
Thank you. :) There are two pieces of information that that aren't in the data set that I think would be strong indicators of the employment situation in Calgary would be real wage growth (or decline) and part-time versus full time employment. Still I think things are starting to move in the right direction. I hope we see some re-absorption of the growing labour force soon.
 
I kind of suspect that things will pick up. Unemployment numbers can be deceiving....don't get me wrong, things are tough right now, but the 10% figure doesn't necessarily reflect the whole situation. The growing work force population helps keep that deceiving, as Calgary has had a high number of people turning 15 over the last few years, more-so than other Canadian cities, so the numbers get skewed a bit.

I'd love to see oil hit $65.00 a barrel and stay there for a while. Not overly expensive, but enough for the oil industry to get back on their feet.
 
I thought I'd update a few of these charts with December figures. It's mostly good new for Calgary. Employment and the Participation Rate are up and Unemployment and the Unemployment Rate are down a smidgeon.

I also have some of the provincial numbers to try to illustrate the part time vs. full time split. Part time was down, but fulltime was up more. So, that's generally good news too. Alberta's overall unemployment rate declined from 9% to 8.5% month over month.

upload_2017-1-6_15-38-29.png


upload_2017-1-6_15-29-6.png

upload_2017-1-6_15-30-21.png

upload_2017-1-6_15-33-36.png

upload_2017-1-6_15-34-38.png
 

Attachments

  • upload_2017-1-6_15-29-6.png
    upload_2017-1-6_15-29-6.png
    42.4 KB · Views: 1,426
  • upload_2017-1-6_15-30-21.png
    upload_2017-1-6_15-30-21.png
    40.4 KB · Views: 1,433
  • upload_2017-1-6_15-33-36.png
    upload_2017-1-6_15-33-36.png
    46.4 KB · Views: 1,370
  • upload_2017-1-6_15-34-38.png
    upload_2017-1-6_15-34-38.png
    39.5 KB · Views: 1,419
  • upload_2017-1-6_15-38-29.png
    upload_2017-1-6_15-38-29.png
    10 KB · Views: 1,432
Thanks for posting Oddball!

I saw this on Twitter the other day... Not sure how accurate it is, but it is good news nonetheless.
C1vcrW3UUAESVbX.jpg:large
 
Interesting share. Thanks SP. I'm surprised that there could be so many jobs tied to a single route as well. I've never done any travel to Mexico, so maybe I underestimate the demand, but it does seem like a awful lot.
 
Interesting share. Thanks SP. I'm surprised that there could be so many jobs tied to a single route as well. I've never done any travel to Mexico, so maybe I underestimate the demand, but it does seem like a awful lot.
I wonder the same thing. I can't think of how that would add up to 320+ full time jobs.
 
January's Labour Force Statistics are out. It was a good month nationally as unemployement fell 0.1% to 6.8%. In Alberta things weren't as hot, the unemployment rate rose to 8.8% from 8.5% and the mixed shifted more from full-time employement to part-time employment. It's hard to know exactly how the full-time vs. part-time reflects at the CMA level, but overall Calgary seemed to have bucked the provincial trend and unemployement fell from 10.1% to 9.8%. This months data contained several revisions so the charts I put up won't look exactly the same as the last ones.

Also, if schadenfreude is on the menu, then you''ll be happy to know that the pain seems to be coming to Edmonton now. Their unemployement rate hit a new peak in January at 8.1%. In all seriousness, I'm sure no one here wants to hear about anyone losing their jobs, even it is in Edmonton, but I wonder is there's been some delayed pain becuase of provincial policy. I'll have to see if I can find some unemployement by NAICS code information to see what's happening.

upload_2017-2-10_10-5-39.png

upload_2017-2-10_10-30-33.png

upload_2017-2-10_9-58-53.png

upload_2017-2-10_9-58-4.png
 

Attachments

  • upload_2017-2-10_9-58-4.png
    upload_2017-2-10_9-58-4.png
    40.8 KB · Views: 1,381
  • upload_2017-2-10_9-58-53.png
    upload_2017-2-10_9-58-53.png
    47.8 KB · Views: 1,416
  • upload_2017-2-10_10-5-39.png
    upload_2017-2-10_10-5-39.png
    43.3 KB · Views: 1,416
  • upload_2017-2-10_10-30-33.png
    upload_2017-2-10_10-30-33.png
    41.5 KB · Views: 1,381
I suspect one of the reasons for the slow down in Alberta in January is due to the oil industry having a typical slowdown at this time of year. That might affect Edmonton more due to their being more operations type jobs there.

Good to see Calgary is at least trending downward.
 
Yeah good question regarding seasonal effects. I am using Statcan's "Seasonally Adjusted" data, but I don't really know the ramifications are for these numbers.
 
Last edited:

Back
Top